BI Dashboard and Reports (SSRS and Power BI)
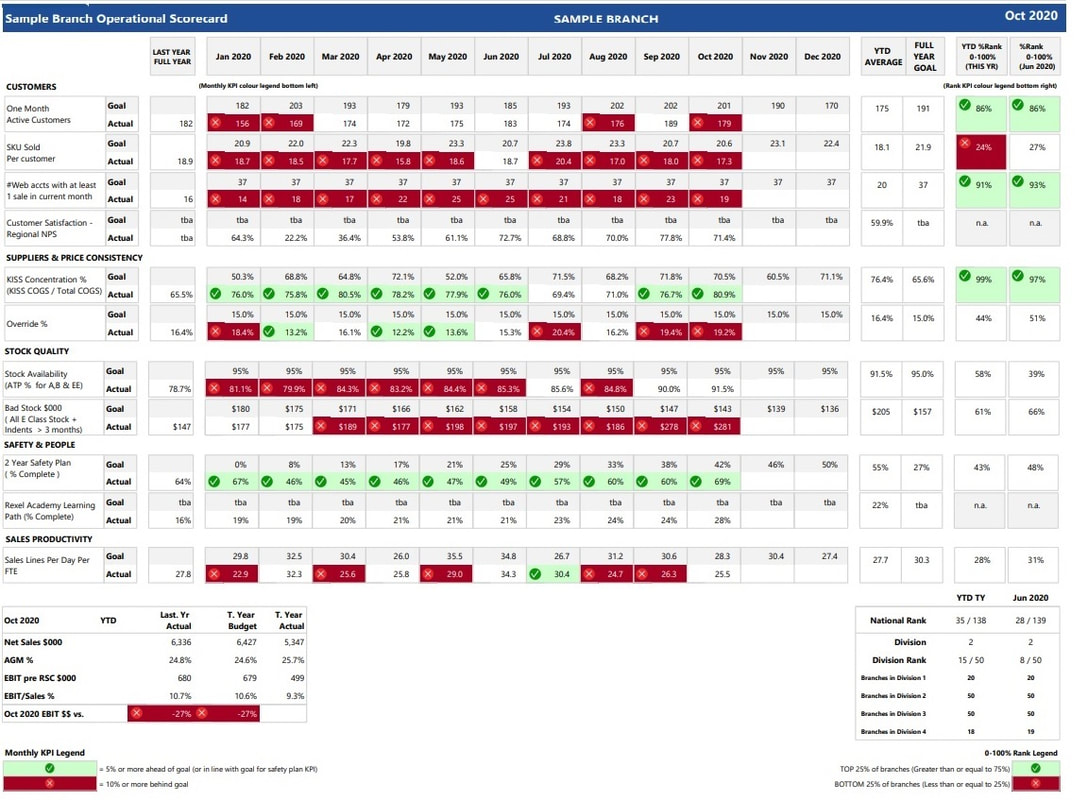
Sample Branch Scorecard - Monthly report that measures branch performance. Includes targets, KPIs and actuals for each branch KPI.
The report includes Branch Financials Summary and Overall Ranking vs other branch in the report footers. The report was developed using SSRS with MDX/SQL Scripts as dataset. KPI targets are loaded yearly in the Master Data Services and process including actuals as part of the MS Analysis Cube.
The report includes Branch Financials Summary and Overall Ranking vs other branch in the report footers. The report was developed using SSRS with MDX/SQL Scripts as dataset. KPI targets are loaded yearly in the Master Data Services and process including actuals as part of the MS Analysis Cube.
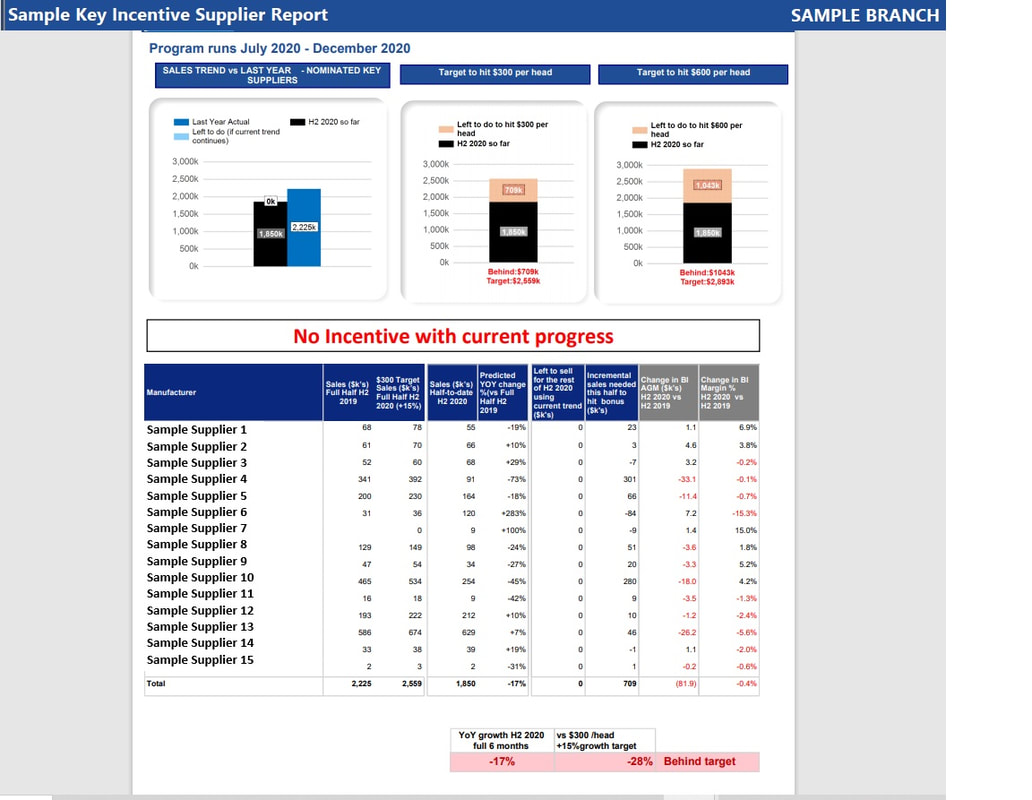
Sample Supplier Key Incentive Report for Branch - Monthly report that measures branch half year sales over selected key suppliers vs same period last year. Includes target 1 that are set to last year sales plus 15% increase and target 2 set to last year sales plus 30% increase.
The report was developed using SSRS with MDX/SQL Scripts as dataset. Targets are calculated in the Dataset.
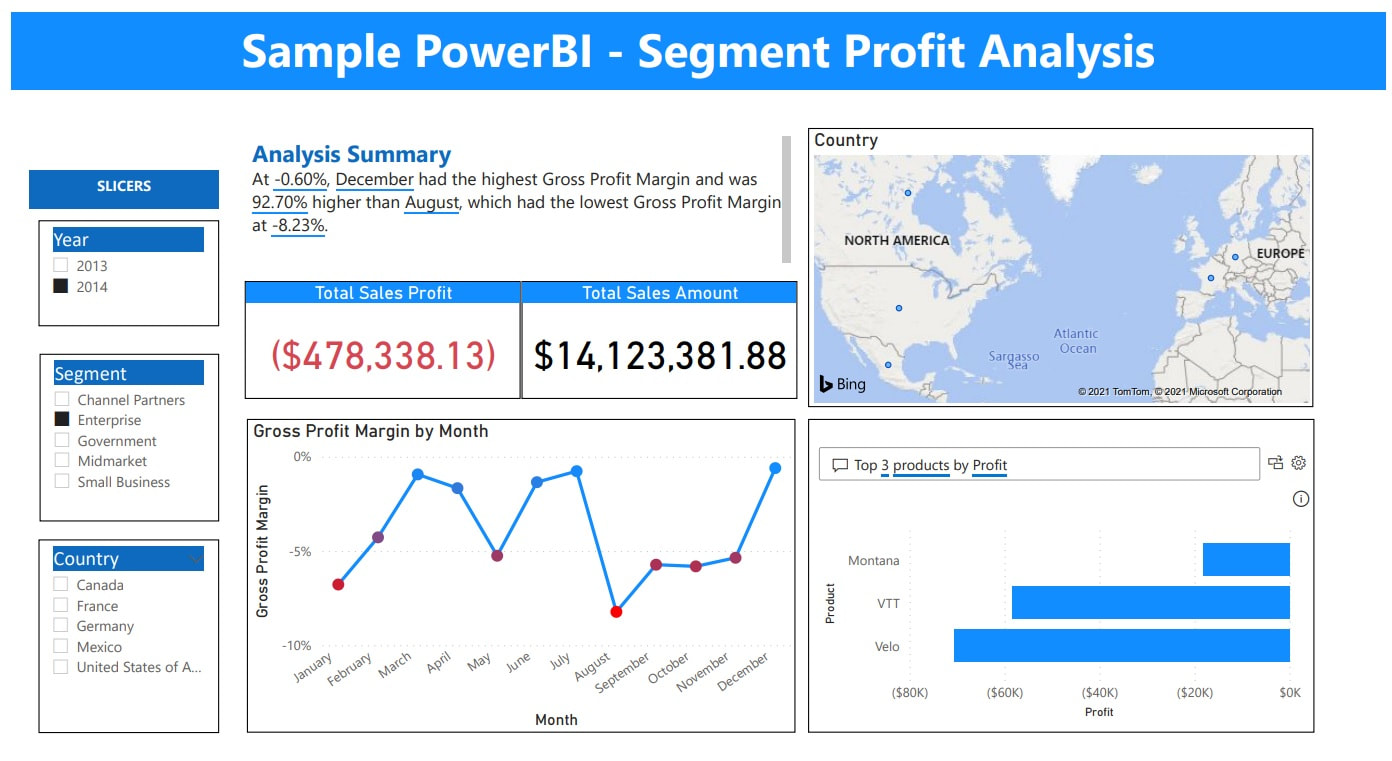
Sample report created in Power BI using sample data from Microsoft. Shows several visualizations (cards, charts, maps) to provide insights to Profit Analysis .
Use smart narratives visualization to summarize the Profit Analysis of selected segment for the full year selected.
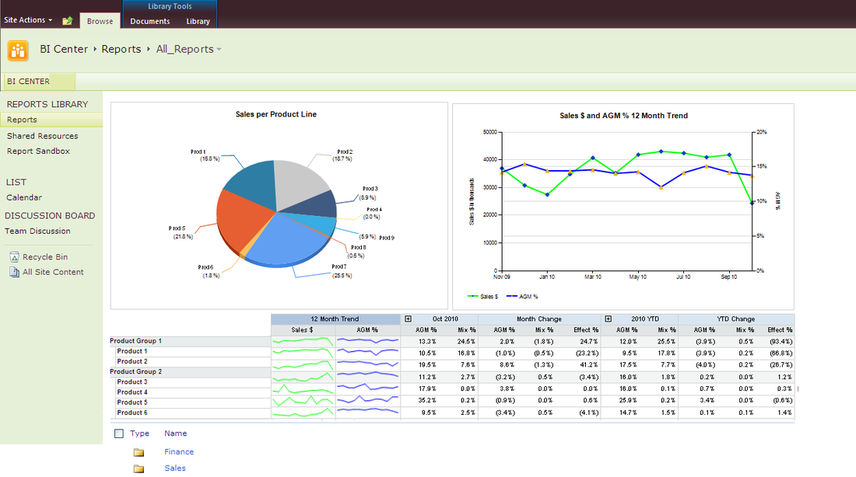
Sample SSRS report integrated with SharePoint. Used SharePoint report web part to display report.
BI Center - SharePoint - SSRS Integration
.
